1 Introduction
Democratic innovations are increasingly implemented in politics, governance, policy, and public administration (Elstub & Escobar 2019). One particular type of innovation that has gained widespread attention from both scholars and practitioners is the deliberative mini-public. Mini-publics typically invite a small group of citizens to discuss a political issue as part of a broader decision-making process (Smith 2009). Citizens’ assemblies and citizens’ juries are two examples.
In accordance with deliberative democratic theory, participants in mini-publics are expected to engage in reason giving, and revise their opinions when exposed to better arguments (Smith 2009). Most scholars suggest selecting participants by stratified or quota sampling to ensure the inclusion of different arguments and perspectives (Brown 2006; Parkinson 2006; Smith 2009).
Taking into account the perspectives of different kinds of people is crucial for identifying public interests. However, sampling based on group membership not only ensures the presence of people from different social groups. Under the condition that selected individuals are informed about the sampling process, which is usually the case in mini-publics,1 sampling based on group membership reinforces the meaning of belonging (or not) to the sampled groups (Mansbridge 2005). In other words, socially stratified sampling emphasizes the salience of social group differences. Given that the deliberative process largely entails addressing and adjudicating differences, the paper explores whether this emphasis affects individuals’ expectations of deliberation.
The deliberation literature features different perspectives on the role of differences in deliberation. The classic take on deliberation tends to prescribe a (pragmatic) transcendence of participants’ particular history and affiliations (Habermas 1990: 104–109, 177–179). However, newer notions of deliberation emphasize differences as a resource that contextualizes all positions and thereby better enables participants to arrive at wise and just solutions to collective problems (Benhabib 1992; Williams 2000; Young 1996). While adherents of the first perspective fear that an emphasis on social differences fixates standpoints and lowers the quality of communication, proponents of the difference as a resource perspective assert that the recognition of social differences is necessary for acquiring a deep understanding of different positions. Based on these perspectives, I expect an increase in social group salience to lower expectations of humble communication and reflexivity2 during the deliberative process (H1), but to raise expectations of observing and acknowledging differences (H2).
To test the hypotheses, I conduct a survey experiment, in which I ask respondents to imagine being invited to a mini-public on either immigration control or gender quotas. I find that an emphasis on social group differences does not lower expectations of humble communication and reflexivity during the deliberation (H1). However, it does raise expectations of observing and acknowledging differences (H2). Further analyses show that the effect is driven by respondents who were asked to imagine deliberating on gender quotas. In addition, the effect is larger for women than for men. An examination of possible mechanisms shows that increased perceptions of the mini-public’s ability to counteract power relations could explain why an emphasis on social group differences would increase expectations of observing and acknowledging differences during the deliberation.
2 Theory and Hypotheses
Deliberative democracy is “a family of views according to which the public deliberation of free and equal citizens is the core of legitimate political decision-making and self- government” (Bohman 1998: 401). The underlying idea is that while practices such as voting and lobbying encourage strategic and self-interested actions, communication helps citizens identify public concerns and the common good (Habermas 1984; 1996).
In recent decades, deliberative democratic theory has taken an institutional turn (Chambers 2009; Ryan & Smith 2014). One particular type of deliberative institution that has gained widespread scholarly attention is the deliberative mini-public. Mini-publics are invited spaces for deliberation, characterized by discussions among citizens in small groups and plenary sessions. They usually last a few days and aim to align political decision making with the considered views of citizens (Smith 2009). Some examples of mini-publics are citizens’ assemblies, citizens’ juries and planning cells.
Participants in mini-publics are expected to develop a standpoint, give reasons for their standpoint, understand and evaluate the reasons behind other people’s standpoints, and revise their opinions if faced with more convincing arguments (Smith 2009). An important condition for identifying common concerns using such a process is the presence of people with different perspectives. In order to make sure that the perspectives of people from socially marginalized groups are taken into account, participants are often selected through stratified or quota sampling (Parkinson 2006; Smith 2009).3
These sampling methods ensure that individuals from different social groups participate in the mini-public. However, they also reinforce the meaning of belonging (or not) to a particular group. As Jane Mansbrdige has noted, “quotas tend to reinforce the existing human cognitive tendencies to see the members of the group as more similar than they are and more different from members of other groups … based by their nature on group membership, quotas are also almost certain to reinforce the social and personal meanings of that membership” (Mansbridge 2005: 632–633). Thus, given that participants have information about the sampling process, selecting participants on the basis of social groups emphasizes the salience of differences between groups.4 Because most of the rules and guidelines for deliberative processes are about recognizing, processing, and responding to differences, this paper asks whether—and how—emphasizing social differences affects individuals’ expectations of the deliberative process.
While individuals’ expectations of deliberation do not necessarily determine the process or outcome of an actual deliberation, they are important since they are likely to influence the quality of the deliberative process (Gustafson & Hertting 2017). If participants have high expectations of deliberative interactions, they are more likely to try to be a good deliberator. This assumption is supported by “the logic of appropriateness” in institutional theory, according to which rules are followed if they are perceived to be reasonable and to have normative validity (March & Olsen 2004). Thus, individuals are likely to be good deliberators if they believe the deliberation is a good idea and if they expect the process to have a meaningful outcome.
Deliberative democratic theory features different views on the role of differences in the deliberative process. According to Habermas, the deliberative process begins with differences, but ends with establishing common interests when participants manage to stretch beyond “the provincial limits of their own particular form of life” (Habermas 1990: 202). Although Habermas is sceptical of decontextualized ethical theory, he nevertheless expects discursively tested and justified norms to lose their motivational and contextual anchoring (Habermas 1990: 106). From this point of view, attending to situated experiences and claims during deliberation risks obstructing the public interest. Following a similar logic, scholars have argued that emphasizing differences presents an obstacle to identifying public concerns since it discourages individuals from putting their particularities aside (Elshtain 1995; Ward 1991). More precisely, these scholars assert that an emphasis on social groups risks encouraging self-interest, fixation of standpoints, balkanization, enmity, and distrust of non-group individuals, which destroys the commitment to dialogue, openness, and the common good.
More recent notions of deliberation reject the idea that the common good lies above, or beneath, social particularities. They stress that perspectives lie beyond one another, and cannot be bracketed for the benefit of an unsituated moral point of view. Rejecting the idea of agent-neutral reason, scholars now regard differences as a resource that teaches discussants about the particularity of their perspective, and forces them to acknowledge uniquely situated others (Benhabib 1992; Williams 2000; Young 1996, 2000). According to this line of thinking, such learning can better stimulate the assessment of social problems and proposals for solving them justly. It is important to note that the group differences emphasized by these scholars are not reducible to differences in group identity (defined as a set of essential attributes). Social groups are understood as relationally constituted positions, which condition privilege, opportunities, and experiences, and thereby generate particular and partial knowledge of society (Young 2000: 87–92). Thus, situated knowledge of social positions helps participants understand the particularity and partiality of their perspectives by uncovering the relation between their standpoint and their social position, as well as the structural relations of power that often allow some groups to dominate the definition of the common good (Young 2000: 115–120).
Social group differences may very well serve as a resource in deliberations. However, the two perspectives above suggest it is plausible that emphasizing differences could trigger an empirical trade-off between seeing others and their otherness and cognitively mixing with others. More precisely, an emphasis on social group differences could encourage a willingness to understand where others are situated and how one’s own position differs from theirs, which is an aspect of deliberation that the difference as a resource perspective highlights. At the same time, it could decrease the incentives to build commonalities through careful interpretation and reconsideration, which is especially important to classic deliberative democrats. Based on this potential trade-off, this paper tests two, non-exclusive, hypotheses:
H1: An increased salience of social groups lowers expectations of humble communication and reflexivity during the deliberative process.
H2: An increased salience of social groups raises expectations that differences will be observed and acknowledged during the deliberative process.
3 Previous Studies
A series of previous studies have observed group dynamics in deliberative settings. Many studies are centred on minority influence: they show that minority opinion can lead majorities to consider new alternatives and perspectives (Nemeth 1986; Nemeth & Kwan 1985; Nemeth & Wachtler 1983; Turner 1991), to seek out and process new information (Nemeth & Rogers 1996; Nemeth & Mayseless 1987), and make members of the majority ask themselves why the minority thinks as it does (Moscovici 1980). Further, studies have found that the presence of women and minorities affects the outcome of deliberations (Fishkin 2009; Lindell et al. 2017; Mendelberg et al. 2014).
The effect of anticipating belonging to a minority or majority has also been studied. Individuals who anticipate being part of the majority have been found to be likely to enter a deliberative situation prepared to ignore opposing views, while people who expect to be part of a minority are likely to be open minded towards opposing views (Zdaniuk & Levine 1996).
There are also several studies on group dynamics in mini-publics. In a study of deliberation on sexual minority rights in Poland, Wojcieszak (2011) found that strong opinions tend to polarize following perceived disagreement during deliberation. However, in a Finnish citizen deliberation experiment on immigration, Grönlund et al. (2015) found no difference in polarization between like-minded and mixed groups. Further, in case studies of the Deliberative Poll in the US, Mongolia, Uganada, and the EU, Fishkin observed that the group discussions generally did not move toward the positions favored by the more advantaged in terms of gender, class, and income (Fishkin, 2018).
Unlike the above studies, I do not focus here on group polarization, minority influence, or the effect of resourceful individuals. Rather, I investigate the effect of an external (institutionally stipulated) emphasis on social difference prior to deliberation. The findings are important for understanding the relationship between the practices of deliberative institutions and the norms of deliberative theory.
4 Method and Data
To study the relationship between social group salience and expectations about deliberation, I conducted an experimental survey in Sweden. I asked respondents to imagine being invited to take part in a deliberative mini-public on either ID checks at the Swedish border to Denmark as a way to deal with increased immigration,5 or gender quotas for boards of directors as a way to combat sexual harassment in the workplace. These two issues were chosen because they appeared extensively in the public debate, and are issues for which social groups’ perspectives and experiences could conceivably create disagreements.6 Respondents were randomly assigned to one of the two issues.
After exposing the respondents to the vignette described above, they were randomly assigned to either a control group or one of two treatment groups (see Figure 1). I informed the control group (one-third of the respondents) that the participants of the mini-public were randomly selected to include different experiences and perspectives. Respondents in the treatment groups were told that efforts had been made to include citizens from different social groups in the mini-public, that is, thoughts and feelings about social group differences were brought to “the top of their heads” (Zaller 1992). I did this in two different ways. I told one of the treatment groups that people from different social groups tend to have different political experiences and perspectives and that participants have been recruited from different social groups in order to include these different experiences and perspectives (weak treatment). I also provided examples of such groups. I gave the same information to the other treatment group, but I also asked these respondents to self-identify with any social group that they believed would be represented if they participated in the mini-public (strong treatment). I did this to encourage respondents to spend more time thinking about social group differences and their relevance in a political discussion (see Appendix for the exact wording of the vignette and the treatments).
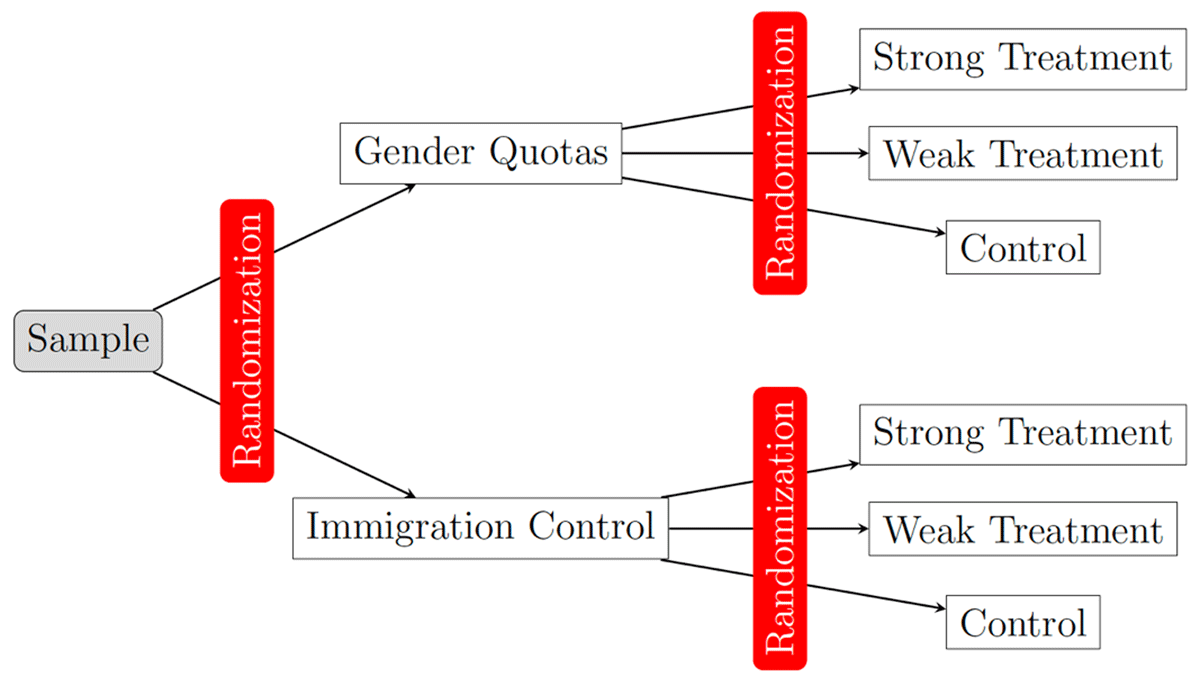
Experimental Design.
Source: Figure constructed by author.
The survey comprised seven statements that measured expectations of the deliberative process. Four statements were designed to measure expectations of humble communication and reflexivity (H1): “We would give each other the chance to explain our opinions,” “We would gain insights into each other’s way of thinking,” “We would be open to change our opinions” and “We would reach a common standpoint on ID checks/gender quotas.” Three statements measured expectations of observing and acknowledging differences (H2): “The discussion would help us understand how our thoughts and opinions on ID checks/gender quotas differ from each other,” “The discussion would reveal many important perspectives on ID checks/gender quotas” and “The discussion would reveal important advantages and disadvantages of ID checks/gender quotas.” The respondents were asked to indicate the likelihood of these events on a scale ranging from 1 (not at all likely) to 4 (very likely). I asked respondents about their expectations of the behaviour of the entire group, rather than their own behaviour, to avoid self-assessment of cognitive skills. See Appendix Table 10 for the coding of all outcome variables.
In addition to the main outcome variables, the survey included questions on the respondents’ background characteristics. Previous research has shown that women, ethnic minorities and younger and lower-income people are more willing to deliberate because they tend to see deliberation as an alternative to “politics as usual”, which they feel frustrated with and excluded from (Neblo et al. 2010). Thus, the opportunity to deliberate may feel particularly important to them. I therefore suspected that they would be more sensitive to the treatment and respond more in agreement with the hypotheses. I investigate the heterogeneity of the treatment effect in section 7. Finally, the survey was designed to measure two theory-driven mechanisms for each hypothesis: expectations of “balkanization” and “distrust” for H1 and thoughts on “particularity” and “power relations” for H2. These measures are further explained and analysed in section 8.
To assure readers that I do not engage in problematic research practices such as under-reporting, p-hacking or hypothesizing after the results are known, I pre-registered the variables, hypotheses and method of this study on Open Science Framework7 before receiving and analysing the data. This paper will highlight and explain departures from the original plan.
The data was collected in collaboration with the Laboratory of Opinion Research (LORE) at Gothenburg University. The survey was sent to LORE’s web panel, which consists of approximately 27,000 respondents in Sweden. It was conducted between June 12 and August 6, 2018. Invitations were sent to 3,600 individuals, and 2,018 individuals participated.8 As stipulated in the pre-registration form, I excluded respondents who did not spend enough time on the vignette page to be able to read and understand the scenario. Given that the average reading speed for silent reading of Swedish non-fiction is around 200 words per minute (Brysbaert 2019), and the rate for in-depth/concentrated reading is 100–200 words per minute (Huang et al. 2013), I included those who spent at least 30 seconds on the vignette page, which describes the scenario in about 90 words and requires both hypothetical thinking and some memorization. This restriction resulted in a sample size of 743 individuals.9 However, for robustness, I will analyse the effect of treatment across a wide range of minimum time periods spent on the vignette.
To ensure that the randomization was correctly conducted, I analysed the balance of background characteristics across the control and treatment groups. Appendix Table 11 reports these results and suggests that the randomization was successful.
5 Descriptive Statistics
Table 1 summarizes the data collected. It shows that 48% of the respondents were women. 10% of the respondents were under 30 years old, 44% were 30–59 and about 46% were over 60. This means that the respondents are older than the average Swedish population, which constitutes about 20% 15–24-year-olds and 20% 65+-year-olds.10 Only 7% of respondents were born outside of Sweden, compared to about 18% for the entire population. The respondents’ highest education levels compared to the general population were 35% for high school (vs. 44%), and 21% for at least three years of university (vs. 27%).
Summary statistics.
| Mean | SD | Min | Median | Max | Count | |
|---|---|---|---|---|---|---|
| Women | 0.48 | 0.5 | 0 | 0 | 1 | 723 |
| Under 30 years | 0.1 | 0.03 | 0 | 0 | 1 | 723 |
| 30-59 years | 0.44 | 0.5 | 0 | 0 | 1 | 723 |
| 60+ years | 0.46 | 0.5 | 0 | 0 | 1 | 723 |
| Born in Sweden | 0.93 | 0.24 | 0 | 1 | 1 | 720 |
| High school education (max) | 0.37 | 0.48 | 0 | 0 | 1 | 721 |
| University (min 3 years) | 0.21 | 0.41 | 0 | 0 | 1 | 721 |
| Political interesta | 1.78 | 0.64 | 1 | 2 | 4 | 723 |
| Political participationb | 2.37 | 0.93 | 1 | 2.25 | 6 | 670 |
| Explainc | 3.16 | 0.64 | 1 | 3 | 4 | 677 |
| Understand | 2.8 | 0.68 | 1 | 3 | 4 | 677 |
| Opinion-change | 2.42 | 0.73 | 1 | 2 | 4 | 677 |
| Consensus | 2.14 | 0.7 | 1 | 2 | 4 | 675 |
| Identify differences | 3.1 | 0.64 | 1 | 3 | 4 | 677 |
| Exposed to perspectives | 3.16 | 0.66 | 1 | 3 | 4 | 678 |
| Exposed to Pros&Cons | 3.17 | 0.67 | 1 | 3 | 4 | 679 |
-
a Question about the degree of political interest. Response options: 1-Very interested, 2-Quite interested, 3-Not so interested, 4-Not interested at all.
b Reported as the average response to four questions: purchase/boycott of goods for political reasons, creation/sharing of political content online, visits to political organizations’ websites, and participation in petitions and online uprisings. Response options: 1-Never, 2-Once in a while, 3-Once a month, 4-Several times a month, 5-Every week, 6-Several times a week.
c Variable definitions for the seven outcome variables are explained in the Method and Data section and in Appendix Table 10.
For the seven main outcome variables that measure expectations of the deliberative process, the most common mean value was about 3, which means that “quite likely” was the average response to most of the statements. The exceptions were the means for the expectation of opinion change and the expectation of consensus, which were closer to 2 or “not that likely”.
Table 2 shows the correlations between the seven outcome variables in the study. The correlations are all low to moderate, which signals that all of the questions measure unique aspects of the deliberative process. The correlations of the variables that test H2 are in general larger than those between the four variables that test H1. Further, the correlations between the H2 variables and the variables “Opinion-change” and “Consensus” are relatively small, which is expected as these variables measure different hypotheses. However, and somewhat unexpectedly, the three H2 variables correlate quite highly with the variables “Explain” and “Understand”, which test H1.
Correlation matrix.
| H1 | H2 | |||||||
|---|---|---|---|---|---|---|---|---|
| Explain | Understand | Opinion-change | Consensus | Identify differences | Exposed to perspectives | Exposed to Pros&Cons | ||
| H1 | Explain | 1 | ||||||
| Understand | 0.433 | 1 | ||||||
| Opinion-change | 0.319 | 0.460 | 1 | |||||
| Consensus | 0.279 | 0.296 | 0.337 | 1 | ||||
| H2 | Identify differences | 0.378 | 0.375 | 0.284 | 0.212 | 1 | ||
| Exposed to perspectives | 0.355 | 0.350 | 0.244 | 0.182 | 0.446 | 1 | ||
| Exposed to Pros&Cons | 0.372 | 0.324 | 0.227 | 0.191 | 0.469 | 0.571 | 1 | |
6 Results
This section shows the results of analysing the effect of increased social group salience on expectations of deliberation. The results are shown in Table 3. The first column of differences in means in this table shows differences in means between all treated and the control group. While the differences in means for the variables testing H1 are in general small and statistically non-significant, the means for the variables testing H2 are in general 4–5% larger for those in the treatment groups than for those in the control group, and statistically significant at the 1% or 5% level.
The effect of social group salience on expectations of deliberation.
| Variable | (1) | (2) | (3) | Difference in Means | |||||
|---|---|---|---|---|---|---|---|---|---|
| Weak | treatment | Strong | treatment | Control | |||||
| N | Mean/SE | N | Mean/SE | N | Mean/SE | (1&2)–(3) | (1)–(3) | (2)–(3) | |
| H1 | |||||||||
| 1. Explain | 207 | 3.145 (0.044) |
219 | 3.169 (0.040) |
251 | 3.151 (0.043) |
0.006 | –0.006 | 0.018 |
| 2. Understand | 208 | 2.760 (0.045) |
218 | 2.844 (0.046) |
251 | 2.797 (0.043) |
0.006 | –0.037 | 0.047 |
| 3. Opinion-change | 208 | 2.394 (0.049) |
219 | 2.434 (0.052) |
250 | 2.436 (0.045) |
–0.021 | –0.042 | –0.002 |
| 4. Consensus | 206 | 2.073 (0.047) |
218 | 2.147 (0.049) |
251 | 2.199 (0.045) |
–0.088 | –0.126* | –0.052 |
| 5. H1 combined | 205 | 2.590 (0.033) |
217 | 2.651 (0.033) |
250 | 2.646 (0.033) |
–0.025 | –0.056 | 0.005 |
| H2 | |||||||||
| 6. Identify diff | 208 | 3.115 (0.046) |
219 | 3.178 (0.041) |
250 | 3.020 (0.041) |
0.128** | 0.095 | 0.158*** |
| 7. Perspectives | 208 | 3.178 (0.045) |
218 | 3.243 (0.042) |
252 | 3.063 (0.043) |
0.148*** | 0.114* | 0.180*** |
| 8. Pros&Cons | 208 | 3.173 (0.042) |
219 | 3.215 (0.047) |
252 | 3.119 (0.044) |
0.075 | 0.054 | 0.096 |
| 9. H2 combined | 208 | 3.155 (0.035) |
218 | 3.213 (0.035) |
250 | 3.072 (0.035) |
0.113*** | 0.083* | 0.141*** |
Notes: The last three columns refer to differences in means between the treatment groups and the control group. Statistical tests are performed with a t-test, where ***, **, and * indicate significance at the 1, 5, and 10 percent critical level. The variables H1 and H2 combined refer to averages of the H1 and H2 subcategories.
The second and third columns of differences in means in Table 3, display differences in means across the weak treatment group and the control group and the strong treatment group and control group, respectively. The variables testing H2 (variables 6–9) show that the differences in means compared to the control group are smaller for the weak treatment group than for the strong treatment group. A comparison between the control group and the weak treatment group shows that the effect of treatment on the combined measure for H2 (variable 9) is 0.08. This represents a 3% increase in expectations compared to the control group. However, this estimate is only significant at the 10% level. The corresponding effect for the strong treatment group is 0.14, that is, a 5% increase in expectations compared to the control group. This effect is significant at the 1% level. Similar effects can be seen for two of the three individual variables testing H2. All results are robust to including controls for background characteristics (see Appendix Table 12).
Considering that the time limit of 30 seconds spent on the vignette is an arbitrary restriction, I analyse the effect of treatment on the combined measure for H2 across a wide range of minimum time periods spent on the vignette. This is to show that the results for those spending a minimum of 30 seconds on the vignette are not exceptional. As Appendix Table 13 shows, the size of the estimates steadily increases when moving from at least 15 seconds to a 50-second minimum. For the strong treatment, the increase in expectations of observing and acknowledging differences is about 1.5% for those who spent a minimum of 15 seconds on the vignette, and 8% for those who spent at least 50 seconds.
Table 4 focuses on the effect of the strong treatment on expectations of deliberation. It shows the results for the strong gender quotas treatment and strong ID checks treatment separately. Columns 6 to 9 in Table 4 show that the expectations of understanding differences and being exposed to different perspectives and arguments during the deliberative process are in general higher for those who received the strong quotas treatment than for those who received the strong immigration treatment. The effect of the gender quotas treatment on the combined H2 variable (column 9) is 0.19. This represents a 6% increase in expectations compared to the mean of the control group. The effect is significant at the 5% level. The corresponding increase for ID checks is 3% and not statistically significant. However, the differences between those who received the gender quota scenario and those who received the ID checks scenario are not statistically significant.
The effect of social group salience on expectations of deliberation: Gender quotas vs. ID checks.
| (1) | (2) | (3) | (4) | (5) | (6) | (7) | (8) | (9) | |
|---|---|---|---|---|---|---|---|---|---|
| Explain | Understand | Opinion-change | Consensus | H1 combined | Identify diff | Perspectives | Pros&Cons | H2 combined | |
| Gender quotas Strong treatment | 0.0586 (0.0841) |
0.0147 (0.0940) |
–0.0297 (0.104) |
–0.0361 (0.0854) |
0.00172 (0.0674) |
0.254 (0.0845)*** |
0.176 (0.0873)** |
0.135 (0.0933) |
0.189 (0.0731)** |
| Constant | 3.098 (0.0634)*** |
2.750 (0.0628)*** |
2.441 (0.0709)*** |
2.232 (0.0567)*** |
2.631 (0.0479)*** |
2.893 (0.0613)*** |
3 (0.0622)*** |
3.080 (0.0610)*** |
2.991 (0.0515)*** |
| Observations | 214 | 214 | 213 | 214 | 213 | 214 | 214 | 214 | 214 |
| ID checks Strong treatment | –0.0148 (0.0807) |
0.0793 (0.0854) |
0.0213 (0.0923) |
–0.0692 (0.0987) |
0.00912 (0.0646) |
0.0819 (0.0805) |
0.187 (0.0824)** |
0.0637 (0.0889) |
0.104 (0.0671) |
| Constant | 3.194 (0.0577)*** |
2.835 (0.0601)*** |
2.432 (0.0587)*** |
2.173 (0.0677)*** |
2.658 (0.0451)*** |
3.123 (0.0549)*** |
3.114 (0.0601)*** |
3.150 (0.0616)*** |
3.138 (0.0480)*** |
| Observations | 256 | 255 | 256 | 255 | 254 | 255 | 256 | 257 | 254 |
Notes: This table reports the results from a regression of the respective outcome variables on a dummy variable indicating assignment to the strong treatment group. The first panel reports the results for participants that were assigned the gender quotas vignette, while the second panel reports the results for participants that were assigned the immigration control vignette. Robust standard errors in parentheses and significance level indicated by * p < 0.10, ** p < 0.05, *** p < 0.01.
In summary, this section has shown that emphasizing social group differences does not lower expectations of humble communication and reflexivity during the deliberative process (H1). However, such an emphasis seems to raise expectations of observing and acknowledging differences during the discussion (H2), especially if individuals are encouraged to self-identify with social groups (i.e., the stronger treatment). Further, this section has shown that the positive effect of the strong treatment on expectations of observing and acknowledging differences (H2) is driven by individuals who were asked to imagine being invited to deliberate on gender quotas. The effect is much weaker among those who imagined being invited to deliberate on immigration control.
7 Heterogeneous Effects
This section presents interactions between background characteristics and the treatment in order to investigate whether groups that, according to previous research, tend to see deliberation as an alternative to “politics as usual” reacted more strongly to the treatment. Starting with sex, columns 1–4 in Table 5 show no clear pattern of differences between men and women who received the strong treatment with respect to the first hypothesis. The pattern is clearer in regard to the second hypothesis. As columns 7 and 8 show, women are more likely than men in this treatment group to expect the discussion to highlight different important perspectives and clarify the pros and cons of the issue under discussion. The estimate that combines the three variables testing H2 (column 9) shows that the effect for women is 0.23, which is a 7% increase in expectations compared to the mean of the control group. The corresponding effect for men is 0.05, or an increase of about 1.6%. This difference between the sexes is significant at the 10% level.
The effect of the strong treatment*sex on expectations of deliberation.
| (1) | (2) | (3) | (4) | (5) | (6) | (7) | (8) | (9) | |
|---|---|---|---|---|---|---|---|---|---|
| Explain | Understand | Opinion-change | Consensus | H1 combined | Identify diff | Perspectives | Pros&Cons | H2 combined | |
| Strong treatment | –0.00589 (0.0843) |
0.0983 (0.0884) |
–0.0372 (0.0976) |
–0.214 (0.0946)** |
–0.0409 (0.0676) |
0.223 (0.0860)*** |
0.280 (0.0874)*** |
0.227 (0.0873)*** |
0.230 (0.0711)*** |
| Strong × Men | 0.0255 (0.119) |
–0.0951 (0.129) |
0.0379 (0.140) |
0.282 (0.134)** |
0.0700 (0.0950) |
–0.119 (0.119) |
–0.210 (0.121)* |
–0.270 (0.129)** |
–0.184 (0.0998)* |
| Men | –0.0411 (0.0875) |
–0.0313 (0.0890) |
–0.0954 (0.0928) |
–0.280 (0.0900)*** |
–0.112 (0.0671)* |
–0.0273 (0.0844) |
–0.0366 (0.0880) |
–0.0807 (0.0889) |
–0.0632 (0.0724) |
| Constant | 3.182 (0.0648)*** |
2.809 (0.0639)*** |
2.491 (0.0692)*** |
2.355 (0.0627)*** |
2.709 (0.0492)*** |
3.027 (0.0612)*** |
3.081 (0.0667)*** |
3.162 (0.0634)*** |
3.103 (0.0542)*** |
| Observations | 459 | 458 | 458 | 458 | 456 | 458 | 459 | 460 | 457 |
Notes: This table reports the results from a regression of the respective outcome variables on a dummy variable indicating assignment to the strong treatment group, a dummy variable indicating the sex of the respondent and an interaction of the two. Robust standard errors in parentheses and significance level indicated by * p < 0.10, ** p < 0.05, *** p < 0.01.
Table 6 shows the effect of the treatment interacted with sex for the gender quotas treatment only. In general, the results follow the same pattern as in Table 5. However, the difference in the size of the H2 estimates is larger. Column 9 in Table 6 shows that for the gender quotas treatment, the effect of emphasizing social differences on women’s expectations that participants will observe and acknowledge differences is 0.31, which is a 10% increase compared to the control group. The difference between the sexes is significant at the 10% level.
The effect of the strong treatment*sex on expectations of deliberation: Gender quotas only.
| (1) | (2) | (3) | (4) | (5) | (6) | (7) | (8) | (9) | |
|---|---|---|---|---|---|---|---|---|---|
| Explain | Understand | Opinion-change | Consensus | H1 combined | Identify diff | Perspectives | Pros&Cons | H2 combined | |
| Strong treatment | 0.0400 (0.124) |
0.140 (0.126) |
0.0200 (0.146) |
–0.0800 (0.131) |
0.0300 (0.0937) |
0.360 (0.122)*** |
0.300 (0.125)** |
0.260 (0.129)** |
0.307 (0.105)*** |
| Strong × Men | –0.00169 (0.172) |
–0.246 (0.192) |
–0.180 (0.209) |
0.0675 (0.173) |
–0.0900 (0.137) |
–0.195 (0.171) |
–0.280 (0.175) |
–0.285 (0.188) |
–0.253 (0.148)* |
| Men | –0.0183 (0.130) |
0.00576 (0.130) |
0.1000 (0.146) |
–0.167 (0.115) |
–0.0200 (0.0987) |
0.0753 (0.125) |
–1.57e–15 (0.126) |
0.00475 (0.126) |
0.0267 (0.107) |
| Constant | 3.120 (0.0974)*** |
2.740 (0.0939)*** |
2.400 (0.107)*** |
2.320 (0.0830)*** |
2.645 (0.0718)*** |
2.840 (0.0919)*** |
3.000 (0.0947)*** |
3.080 (0.0896)*** |
2.973 (0.0801)*** |
| Observations | 209 | 209 | 208 | 209 | 208 | 209 | 209 | 209 | 209 |
Notes: This table reports the results from a regression of the respective outcome variables on a dummy variable indicating assignment to the strong treatment among respondents assigned to the gender quotas vignette, a dummy variable indicating the sex of the respondent and an interaction of the two. Robust standard errors in parentheses and significance level indicated by * p < 0.10, ** p < 0.05, *** p < 0.01.
Analyses of heterogeneous effects also show that the positive effect of treatment on expectations that participants will learn about different arguments and perspectives is larger among low-income individuals, those without a university education and younger respondents. However, these differences are not statistically significant (see Appendix Tables 14–16).
8 Mechanisms
In order to be able to trace mechanisms, I included two additional questions in the survey. Respondents were asked what they believed would be the biggest reason(s) for reaching and not reaching a common standpoint as a result of the deliberation. They chose from a list of alternatives designed to indicate whether the treatment triggered thoughts on balkanization, horizontal trust, power relations and the particularity/uniqueness of participants. The balkanization and trust variables were designed to capture mechanisms underlying H1. I expected a positive effect on balkanization and distrust as reasons for not reaching a common position if H1 would be confirmed, that is, if an increased salience of social groups would lower expectations of humble communication and reflexivity during the deliberative process.
The power relations and particularity variables were designed to capture mechanisms of H2. The power relations variable measured if respondents chose (dis)respect and equal treatment as reasons for reaching or not reaching a common standpoint. The particularity variable measured feelings of being specially selected as a reason to strive for a common standpoint.11 I expected a positive effect of treatment on these variables if H2 would be confirmed, that is, if an increased salience of social groups would raise expectations of observing and acknowledging differences during the deliberative process.
Finally, I measured practical reasons, such as a shortage of time, presence of experts, and a low number of participants. My expectation was that if the treatment made the respondents think more about social group dynamics, it should have had a negative effect on the practical reasons given for reaching or not reaching a common standpoint. The wording of all survey questions can be found in the appendix.
Columns 1–4 in Table 7 show the effect of the treatment on thoughts about balkanization, horizontal trust, power relations and particularity. I only look for potential mechanisms in the strong treatment group since I did not find a convincing effect of social group salience on expectations of deliberation in the weak treatment group. The fifth column shows the effect on giving practical reasons for reaching or not reaching a common standpoint. Table 7 shows that the most plausible intermediate variable is thoughts about power relations. Column 3 in the table shows that the effect of the strong treatment on thoughts about power relations increases by 0.06 (17%). This estimate is significant at the 5% level.
The effect of treatment on potential intermediate variables.
| (1) | (2) | (3) | (4) | (5) | |
|---|---|---|---|---|---|
| Balkanization | Distrust | Power relations | Particularity | Practical reasons | |
| Strong treatment | –0.0333 (0.0319) |
–0.0131 (0.0159) |
0.0587 (0.0295)** |
–0.0237 (0.0295) |
–0.0350 (0.0304) |
| Constant | 0.524 (0.0224)*** |
0.0810 (0.0117)*** |
0.351 (0.0205)*** |
0.392 (0.0210)*** |
0.529 (0.0214)*** |
| Observations | 985 | 1088 | 1082 | 1083 | 1084 |
Notes: This table reports the results from a regression of the respective intermediate variables on a dummy variable indicating assignment to the strong treatment group. Robust standard errors in parentheses and significance level indicated by * p < 0.10, ** p < 0.05, *** p < 0.01.
Table 8 shows the effect of the strong treatment interacted with the political issue used in the treatment. The first row of column 3 in this table shows that the effect of the strong gender quotas treatment on thoughts about power relations is 0.1, which corresponds to an increase of 28% compared to the control group. This estimate is significant at the 5% level. The corresponding effect for the ID checks treatment is 0.02. However, the difference between the estimates is not statistically significant. Further, column 5 in Table 8 shows that compared to the control group, those who received the strong gender quotas treatment are less likely to give practical reasons for reaching or not reaching a common standpoint. There is no such effect for the strong ID checks treatment. This difference is significant at the 5% level.
The effect of treatment*issue on potential intermediate variables.
| (1) | (2) | (3) | (4) | (5) | |
|---|---|---|---|---|---|
| Balkanization | Distrust | Power relations | Particularity | Practical reasons | |
| Strong treatment | 0.0183 (0.0461) |
–0.0158 (0.0198) |
0.0986 (0.0429)** |
0.0115 (0.0433) |
–0.112 (0.0436)** |
| Strong × ID checks | –0.0981 (0.0637) |
0.00524 (0.0315) |
–0.0771 (0.0590) |
–0.0682 (0.0591) |
0.147 (0.0605)** |
| ID checks | –0.00596 (0.0449) |
0.0368 (0.0232) |
–0.00892 (0.0411) |
–0.0296 (0.0420) |
0.00311 (0.0430) |
| Constant | 0.527 (0.0324)*** |
0.0618 (0.0150)*** |
0.355 (0.0298)*** |
0.408 (0.0305)*** |
0.527 (0.0310)*** |
| Observations | 985 | 1088 | 1082 | 1083 | 1084 |
Notes: This table reports the results from a regression of the respective intermediate variables on a dummy variable indicating assignment to the strong treatment, a dummy variable indicating the topic of deliberation and an interaction of the two. Robust standard errors in parentheses and significance level indicated by * p < 0.10, ** p < 0.05, *** p < 0.01.
Table 9 displays the effect of the strong gender quotas treatment interacted with sex. As columns 3 and 5 show, the effects of treatment on the extent to which respondents refer to power relations and practical reasons for reaching or not reaching a common standpoint are stronger and remain statistically significant at the 5% level among women. The estimates are smaller for men. However, these differences are not statistically significant.
The effect of gender quotas treatment*sex on intermediate variables.
| (1) | (2) | (3) | (4) | (5) | |
|---|---|---|---|---|---|
| Balkanization | Distrust | Power relations | Particularity | Practical reasons | |
| Strong treatment | 0.0610 (0.0679) |
–0.0474 (0.0280)* |
0.159 (0.0631)** |
0.0148 (0.0653) |
–0.147 (0.0646)** |
| Strong × Men | –0.0860 (0.0928) |
0.0588 (0.0405) |
–0.108 (0.0866) |
–0.0294 (0.0875) |
0.0670 (0.0882) |
| Men | –0.0686 (0.0659) |
–0.0151 (0.0312) |
0.0518 (0.0602) |
–0.103 (0.0623) |
–0.0819 (0.0630) |
| Constant | 0.569 (0.0493)*** |
0.0714 (0.0244)*** |
0.321 (0.0443)*** |
0.473 (0.0474)*** |
0.571 (0.0469)*** |
| Observations | 462 | 512 | 511 | 512 | 512 |
Notes: This table reports the results from a regression of the respective intermediate variables on a dummy variable indicating assignment to the strong treatment among respondents assigned to the gender quotas vignette, a dummy variable indicating the sex of the respondent and an interaction of the two. Robust standard errors in parentheses and significance level indicated by * p < 0.10, ** p < 0.05, *** p < 0.01.
In summary, the positive effect of treatment on thoughts about power relations follows a similar pattern to the effect of treatment on the outcome variables that measure H2: the effect is present for the gender quotas treatment but not for the ID checks treatment, and seems to be driven by the female respondents. This similarity strongly indicates that an increase in thinking about power relations is a relevant mechanism in the positive relationship between an emphasis on social group differences and expectations of observing and acknowledging differences (H2). My interpretation of this mechanism is that the salience of group differences raised expectations of observing and acknowledging differences through increased perceptions of the mini-public as an institution that is sensitive to, or has the ability to counteract, power imbalances.
9 Discussion
In summary, this paper shows that emphasizing social group differences raises expectations of observing and acknowledging differences during deliberation in a mini-public. These expectations increase by about 3% as a result of the weak treatment, and by about 5% as a result of the strong treatment. However, only the effect for the strong treatment is statistically significant at the 5% level. Further analysis shows that the treatment effect is slightly larger among those who received the gender quotas treatment and among female respondents. Nevertheless, the effects in this study are smaller than expected. This may be because the information provided to the control and treatment groups was quite similar. As explained in the method section, the control group were told that participants were randomly selected in order to include different experiences and perspectives. This was done to emulate a real-world scenario, in which the selection method is usually explained to participants. However, the idea of randomness and the motivation for it is likely to have raised some thoughts about social group differences, even though social groups were not mentioned to the control group.
The design and results of this study also raise the issue of social desirability bias. It could be argued that by informing the treatment groups about social group differences, and efforts to include such differences, I established the norm that social differences are good. If so, there is a risk that respondents may have tried to comply with that norm rather than report their “true” expectations of the deliberative process (Lavrakas 2008: 825). Thus, I may have inadvertently created a norm that in turn influenced the observed positive effect of treatment on expectations of observing and acknowledging differences (H2). Although this possibility cannot be ruled out, I believe it is unlikely for three reasons. First, as discussed above, the control group was also told about the effort to include differences. Second, respondents were asked to report their expectations of group behaviour, not their own expected behaviour. It should therefore be easier to ignore social acceptability. Third, I found support for an expected mechanism and some subgroup variations. This signals that the respondents’ expectations about the deliberation are likely to be a consequence of reflection on social group dynamics, rather than a tendency to comply with socially acceptable answers.
An intriguing subgroup variation that should be discussed is the one between the gender quotas treatment (gender quotas for boards of directors as a way to combat sexual harassment in the workplace) and the ID checks treatment (ID checks at Sweden’s border to Denmark as a way to deal with increased immigration). I chose immigration and sexual harassment as topics for deliberation because they were highly debated issues in Sweden at the time the survey was carried out. I cannot provide a clear answer for why support for H2 seems to be driven by respondents who received the gender quotas treatment. However, considering that this effect seems to be especially strong among women, and that thoughts about power relations seem to have been triggered, I suspect that an emphasis on social groups could have a positive effect on expectations of observing and acknowledging differences when the topic of deliberation concerns a disadvantaged group that are invited to participate in the deliberation. The chain of thought might go something like this: The deliberation is about gender equality; I am a woman (others are not); my experiences and perspectives as a woman will be given attention; differences will be observed and acknowledged during the deliberation.
To further explore this idea, I have analysed whether the ID checks treatment increases expectations of observing and acknowledging differences among immigrants.12 ID checks may not have a particular impact on immigrants’ living conditions, but immigrants do have the experience of migration and are likely to identify themselves as immigrants. This analysis shows that there is no positive effect on expectations of observing and acknowledging differences (H2) among immigrants who received the ID checks treatment (Appendix Table 17). However, there seems to be a negative effect on expectations of humble communication and reflexivity (H1). As for mechanisms, it seems that an emphasis on social groups in the ID checks treatment increased immigrants’ thoughts on distrust (Appendix Table 18). I cannot explain why an emphasis on social groups made women think about power relations and increased their expectations that differences would be observed and acknowledged during deliberation on gender quotas, while it enhanced immigrants’ thoughts on distrust and lowered their expectations of humble communication and reflexivity during deliberation on ID checks. One plausible reason is that while immigrants are disadvantaged, racism is seldom conceptualized in terms of power in the Swedish political discourse. It is often framed instead in terms of prejudicial attitudes and hostility.13 This could explain why an emphasis on social group differences triggered thoughts about trust (rather than reflections on power relations) among immigrants who received the ID checks treatment.
In summary, the positive effect of emphasizing social groups on expectations of observing and acknowledging differences during a deliberation cannot be generalized to all political issues and social groups. I have suggested that the effect is especially likely to occur among disadvantaged groups if the deliberation concerns their group in particular, and if the deliberation takes place in a context in which their marginalization is understood as a power imbalance. Although the generalizability of the positive relationship between social group salience and expectations about the deliberative process is limited to certain groups and discourses, it is likely that the effect is not specific to deliberation in mini-publics. Future research could explore whether similar effects occur in other forums for deliberative communication, such as town hall meetings and academic seminars.
Additional File
The additional file for this article can be found as follows:
The survey. DOI: https://doi.org/10.16997/jdd.952.s1
Notes
- Conveners of mini-publics are usually transparent about the sampling process. See for example the Climate Assembly UK, where the organizers explained that random stratified sampling would be used to ensure representation in terms of age, gender, education, ethnicity, geography, and attitudes to climate change (Climate Assembly UK 2020). Other recent mini-publics with a transparent sampling process are the Irish Citizens’ Assembly 2016–2018 and the Citizens’ Assembly on Brexit in 2017. ⮭
- Reflexivity: “the critical examination of one’s values, assumptions, and interests in the light of all other relevant claims and reasons” (Dahlberg 2004: 8). ⮭
- Not all mini-publics use these selection methods. The 21st Century Town Meeting is an example of a mini-public that is open to all who wish to engage (Ryan & Smith 2014). The Deliberative Poll uses pure random sampling (Fishkin 2009). ⮭
- Although participants are usually not informed about the criteria according to which they are selected, transparent stratified sampling nevertheless emphasizes the salience of differences between groups. ⮭
- ID checks were introduced in Sweden January 2016 and abolished in May 2017. ⮭
- I chose both the issue of gender equality and immigration control to investigate whether results would be consistent across issues of deliberation. ⮭
- Open Science Framework: https://osf.io/registries. ⮭
- I used the effect sizes and standard deviations of a pilot study I carried out with over 400 students to calculate the sample size needed for 80% power. Assuming an effect size of 5%, standard deviation 0.8, and alpha 5%, I estimated that the total number of respondents needed would be 1341 (447 per group). Based in these estimations, LORE sent out invitations to 3600 individuals to account for their usual response rate. ⮭
- The treatment is not part of the vignette page, and the time restriction therefore does not lead to differences in subgroup sizes. ⮭
- The demographic statistics in this paragraph were retrieved from Statistics Sweden for the year 2017. ⮭
- These measures of thoughts on power relations and particularity are not exhaustive. They were constructed as indicators to measure potential mechanisms in a subtle and casual way. ⮭
- Immigrants are a very small part of my sample, and the analysis is therefore sensitive to outliers. ⮭
- This can be exemplified by the “National plan against racism, similar forms of hostility and hate crimes”: “When the Government uses the term racism in this plan, this refers to opinions that people are essentially different from each other due to assumptions on race, national, cultural or ethnic origin, religion, skin colour or other similar circumstance, and that they therefore can or should be treated in different ways” (Government Offices of Sweden 2017: 11). Compare this to the government’s approach to gender equality: “The overall objective of the gender equality policy is that women and men should have the same power to shape society and their own lives…The overall objective aims at societal structures, processes, conditions and opportunities as well as individual freedom linked to gender and power” (Government Offices of Sweden, 2018). ⮭
Acknowledgements
I thank Olle Folke, Nils Hertting, Markus Holdo, Kaisa Herne, Sofie Marien, Per Adman, Pär Zetterberg, Sebastian Axbard, and two anonymous reviewers for their helpful comments.
Competing Interests
The author has no competing interests to declare.
References
1 Benhabib, S. (1992). Situating the self: Gender, community, and postmodernism in contemporary ethics. Cambridge: Polity Press.
2 Bohman, J. (1998). Survey article: The coming age of deliberative democracy. The Journal of Political Philosophy, 6(4), 400–425. DOI: http://doi.org/10.1111/1467-9760.00061
3 Brown, M. B. (2006). Survey article: Citizen panels and the concept of representation. Journal of Political Philosophy, 14(2), 203–225. DOI: http://doi.org/10.1111/j.1467-9760.2006.00245.x
4 Brysbaert, M. (2019). How many words do we read per minute? A review and meta- analysis of reading rate. Journal of Memory and Language, 109, 104047. DOI: http://doi.org/10.1016/j.jml.2019.104047
5 Chambers, S. (2009). Rhetoric and the public sphere: Has deliberative democracy abandoned mass democracy? Political theory, 37(3), 323–350. DOI: http://doi.org/10.1177/0090591709332336
6 Climate Assembly UK. (2020). Who will take part? Retrieved June 30, 2020 from https://www.climateassembly.uk/about/recruitment/.
7 Dahlberg, L. (2004). The Habermasian public sphere: A specification of the idealized conditions of democratic communication. Studies in Social and Political Thought, 10, 2–18.
8 Elshtain, J. B. (1995). Democracy on trial. New York: Basic Books.
9 Elstub, S., & Escobar, O. (2019). The Handbook of Democratic Innovation and Governance. Cheltenham: Edward Elgar. DOI: http://doi.org/10.4337/9781786433862
10 Fishkin, J. S. (2009). When the people speak: Deliberative democracy and public consultation. Oxford: Oxford University Press.
11 Fishkin, J. S. (2018). Democracy when the people are thinking: Revitalizing our politics through public deliberation. Oxford: Oxford University Press. DOI: http://doi.org/10.1093/oso/9780198820291.001.0001
12 Government Offices of Sweden. (2017). A comprehensive approach to combat racism and hate crime. National plan to combat racism, similar forms of hostility and hate crime. Retrieved October 8, 2018 from https://www.regeringen.se/492382/contentassets/173251a50a5e4798bcafc15ba871a411/a-comprehensive-approach-to-combat-racism-and-hate-crime
13 Government Offices of Sweden. (2018). Mer om jämställdhetspolitikens mål. Retrieved October 8, 2018 from https://www.regeringen.se/artiklar/2017/01/mer-om-jamstalldhetspolitikens-mal/
14 Grönlund, K., Herne, K., & Setälä, M. (2015). Does enclave deliberation polarize opinions? Political Behavior, 37(4), 995–1020. DOI: http://doi.org/10.1007/s11109-015-9304-x
15 Gustafson, P., & Hertting, N. (2017). Understanding participatory governance: An analysis of participants’ motives for participation. The American Review of Public Administration, 47(5), 538–549. DOI: http://doi.org/10.1177/0275074015626298
16 Habermas, J. (1984). The theory of communicative action, volume 1. Cambridge: Polity Press.
17 Habermas, J. (1990). Moral consciousness and communicative action. Cambridge, MA: MIT Press.
18 Habermas, J. (1996). Between facts and norms: Contributions to a discourse theory of law and democracy. Cambridge, MA: MIT Press. DOI: http://doi.org/10.7551/mitpress/1564.001.0001
19 Huang, Y.-M., Liang, T.-H., & Chiu, C.-H. (2013). Gender differences in the reading of e-books: Investigating children’s attitudes, reading behaviors and outcomes. Journal of Educational Technology & Society, 16(4), 97–110.
20 Lavrakas, P. J. (2008). Encyclopedia of survey research methods. Thousand Oaks, CA: Sage Publications. DOI: http://doi.org/10.4135/9781412963947
21 Lindell, M., BÄCHTIGER, A., GRÖNLUND, K., Herne, K., SETÄLÄ, M., & Wyss, D. (2017). What drives the polarisation and moderation of opinions? Evidence from a Finnish citizen deliberation experiment on immigration. European Journal of Political Research, 56(1), 23–45. DOI: http://doi.org/10.1111/1475-6765.12162
22 Mansbridge, J. (2005). Quota problems: Combating the dangers of essentialism. Politics & Gender, 1(4), 622–638. DOI: http://doi.org/10.1017/S1743923X05220196
23 March, J. G., & Olsen, J. P. (2004). The logic of appropriateness. In M. Rein, M. Moran, & R. Goodin (Eds.), The Oxford handbook of political science (p. 478–497). Oxford: Oxford University Press.
24 Mendelberg, T., Karpowitz, C. F., & Goedert, N. (2014). Does descriptive representation facilitate women’s distinctive voice? How gender composition and decision rules affect deliberation. American Journal of Political Science, 58(2), 291–306. DOI: http://doi.org/10.1111/ajps.12077
25 Moscovici, S. (1980). Toward a theory of conversion behavior. Advances in experimental social psychology, 13, 209–239. DOI: http://doi.org/10.1016/S0065-2601(08)60133-1
26 Neblo, M. A., Esterling, K. M., Kennedy, R. P., Lazer, D. M., & Sokhey, A. E. (2010). Who wants to deliberate—And why? American Political Science Review, 104(3), 566–583. DOI: http://doi.org/10.1017/S0003055410000298
27 Nemeth, C., & Rogers, J. (1996). Dissent and the search for information. British Journal of Social Psychology, 35(1), 67–76. DOI: http://doi.org/10.1111/j.2044-8309.1996.tb01083.x
28 Nemeth, C. J. (1986). Differential contributions of majority and minority influence. Psychological Review, 93(1), 23. DOI: http://doi.org/10.1037/0033-295X.93.1.23
29 Nemeth, C. J., & Kwan, J. L. (1985). Originality of word associations as a function of majority vs. minority influence. Social Psychology Quarterly, 48(3), 277–282. DOI: http://doi.org/10.2307/3033688
30 Nemeth, C. J., & Mayseless, O. (1987). Enhancing Recall: The Contributions of Conflict, Minorities, and Consistency. Berkeley CA: University of California.
31 Nemeth, C. J., & Wachtler, J. (1983). Creative problem solving as a result of majority vs minority influence. European Journal of Social Psychology, 13(1), 45–55. DOI: http://doi.org/10.1002/ejsp.2420130103
32 Parkinson, J. (2006). Deliberating in the real world: Problems of legitimacy in deliberative democracy. Oxford: Oxford University Press. DOI: http://doi.org/10.1093/019929111X.001.0001
33 Ryan, M., & Smith, G. (2014). Defining mini-publics. In K. Grönlund, A. B¨achtiger and M. Seta¨la¨ (Eds.), Deliberative Mini-Publics: Involving Citizens in the Democratic Process (pp. 9–26). Colchester: ECPR Press.
34 Smith, G. (2009). Democratic innovations: Designing institutions for citizen participation. Cambridge: Cambridge University Press. DOI: http://doi.org/10.1017/CBO9780511609848
35 Turner, J. C. (1991). Social influence. Buckingham: Open University Press.
36 Ward, C. V. (1991). The limits of “liberal republicanism”: Why group-based remedies and republican citizenship don’t mix. Columbia Law Review, 91(3), 581–607. DOI: http://doi.org/10.2307/1122799
37 Williams, M. (2000). The uneasy alliance of group representation and deliberative democracy. In W. Kymlicka, & W. J. Norman (Eds.), Citizenship in diverse societies (p. 124–54). Oxford: Oxford University Press. DOI: http://doi.org/10.1093/019829770X.003.0005
38 Wojcieszak, M. (2011). Deliberation and attitude polarization. Journal of Communication, 61(4), 596–617. DOI: http://doi.org/10.1111/j.1460-2466.2011.01568.x
39 Young, I. M. (1996). Communication and the other: Beyond deliberative democracy. In S. Benhabib (Ed.), Democracy and difference: Contesting the boundaries of the political (p. 120–135). Princeton: Princeton University Press. DOI: http://doi.org/10.1515/9780691234168-007
40 Young, M. I. (2000). Inclusion and democracy. Oxford: Oxford University Press. DOI: http://doi.org/10.1017/CBO9780511818691
41 Zaller, J. (1992). The nature and origins of mass opinion. Cambridge: Cambridge University Press.
42 Zdaniuk, B., & Levine, J. M. (1996). Anticipated interaction and thought generation: The role of faction size. British Journal of Social Psychology, 35(1), 201–218. DOI: http://doi.org/10.1111/j.2044-8309.1996.tb01092.x